

Procedural generation is a cornerstone of modern game development. From vast open worlds to emergent AI systems, much of the magic comes from math. One of the most powerful tools you can add to your toolbox is the Voronoi diagram — a way to divide space that feels both organic and natural.
In this tutorial, we’ll explore what Voronoi diagrams are, why they’re so useful in games, and how to implement them step by step with code and interactive examples. By the end, you’ll be able to generate maps, divide AI territories, and even create stylized effects — all powered by Voronoi.
What is a Voronoi Diagram?
Imagine dropping a handful of seeds on the ground. Now imagine each seed growing into a patch of land that extends until it touches the edges of its neighbors. That’s the intuition behind Voronoi diagrams.
Formally:
A Voronoi diagram partitions space into regions (cells) around a set of points (called sites). Each region contains all the locations closest to its site compared to any other.
You’ve seen this before in nature:
- Giraffe spots
- Cracked mud
- Soap bubbles
This “nearest neighbor” principle is surprisingly powerful in game design.
Why Use Voronoi in Games?
Voronoi diagrams have endless uses in game development:
- Procedural Maps: Create natural-looking biomes, continents, or city districts.
- AI Territories: Divide a map into zones of control for factions or bases.
- Resource Distribution: Cluster ores, plants, or loot in believable ways.
- Stylized Visuals: Generate organic textures, magic shields, or sci-fi overlays.
- Level Design: Build irregular dungeon rooms and organic caves.
If you’ve ever wanted your game world to look less like a grid and more like something alive, Voronoi is a great place to start.
Step-by-Step Lab #1: Basic Voronoi Cells
Let’s create our first Voronoi diagram using JavaScript and the d3-delaunay library.
Step 1: Set up a canvas
Commented Code
<!-- Step 1: Set up a canvas element in HTML -->
<!--
  This <canvas> tag creates a drawing surface where we will render our Voronoi diagram.
  The `id="voronoi"` lets us reference it from JavaScript.
  The width and height are set to 500 pixels each, giving us a square drawing area.
-->
<canvas id="voronoi" width="500" height="500"></canvas>

<script type="module">
/*
  Import the Delaunay class from the d3-delaunay library.
  - d3-delaunay is a powerful library for working with Delaunay triangulations
    and Voronoi diagrams.
  - The `Delaunay` object provides methods to generate Voronoi diagrams from a
    set of points.
  - The "type=module" attribute on the <script> tag allows us to use ES6 imports
    directly in the browser.
*/
import {Delaunay} from "https://cdn.jsdelivr.net/npm/d3-delaunay@6/+esm";

/*
  Get a reference to the <canvas> element from the DOM.
  - document.getElementById("voronoi") looks up the canvas by its `id`.
  - We will use this canvas as the drawing surface for our visualization.
*/
const canvas = document.getElementById("voronoi");

/*
  Get the 2D rendering context of the canvas.
  - The "2d" context provides functions for drawing shapes, lines, paths, and images.
  - All of our Voronoi diagram drawing will be done through this context.
*/
const ctx = canvas.getContext("2d");

/*
  Store the canvas dimensions in variables for convenience.
  - `canvas.width` gives the width (500 in this case).
  - `canvas.height` gives the height (500 in this case).
  - By storing them in `width` and `height`, we can reuse these values later
    instead of repeatedly accessing the canvas object.
*/
const width = canvas.width;
const height = canvas.height;

</script>
Uncommented Code
<canvas id="voronoi" width="500" height="500"></canvas>
<script type="module">
import {Delaunay} from "https://cdn.jsdelivr.net/npm/d3-delaunay@6/+esm";

const canvas = document.getElementById("voronoi");
const ctx = canvas.getContext("2d");
const width = canvas.width;
const height = canvas.height;
</script>
// Step 1: Set up the canvas and prepare drawing tools
// ---------------------------------------------------
// The canvas will be used to display the Voronoi diagram.
// We also need access to its 2D context for drawing operations.


// Import the Delaunay class from the d3-delaunay library
IMPORT Delaunay FROM "d3-delaunay"

// Get a reference to the canvas element by its ID
DECLARE canvas = GET_ELEMENT_BY_ID("voronoi")

// Retrieve the 2D drawing context from the canvas
DECLARE ctx = canvas.GET_CONTEXT("2d")

// Store canvas dimensions for later use
DECLARE width = canvas.width
DECLARE height = canvas.height

// Now we have the canvas and context ready for rendering
Step 2: Generate random points
Commented Code
/*
  Step 2: Generate random points
  ------------------------------
  To create a Voronoi diagram, we need a set of "sites" (points) in 2D space.
  Each site will define one region of the diagram.
  In this step, we generate 20 random points inside the canvas dimensions.
*/

const points = Array.from(
  { length: 20 },       // Create an array-like object with 20 slots.
  () => [               // For each slot, generate a point represented as an [x, y] array.
    Math.random() * width,   // Random x coordinate between 0 and canvas width.
    Math.random() * height   // Random y coordinate between 0 and canvas height.
  ]
);

/*
  Explanation:
  - `Array.from({length: 20}, fn)` creates an array of 20 elements,
    where each element is generated by the function `fn`.
  - The function returns `[x, y]`, a pair of numbers representing a 2D point.
  - `Math.random()` gives a random number between 0 and 1. Multiplying by
    `width` or `height` scales it to the canvas dimensions.
  - As a result, we get 20 random points scattered within the 500×500 canvas.

  Next step: We’ll feed these points into the Delaunay/Voronoi generator
  to construct the diagram.
*/
Uncommented Code
const points = Array.from({length: 20}, () => [
  Math.random() * width,
  Math.random() * height
]);
// Step 2: Generate random points for the Voronoi diagram
// ------------------------------------------------------
// Each point represents a "site" that defines one region
// We will create 20 random points inside the canvas area
DECLARE points = EMPTY_ARRAY // Initialize an empty array to store the points
FOR i FROM 1 TO 20 DO
// Generate a random x coordinate between 0 and the canvas width
DECLARE x = RANDOM() * width
// Generate a random y coordinate between 0 and the canvas height
DECLARE y = RANDOM() * height
// Combine x and y into a point and add it to the array
APPEND [x, y] TO points
END FOR
// Now 'points' contains 20 randomly scattered [x, y] coordinates
// These points will be used to construct the Voronoi diagram
Step 3: Build and render Voronoi cells
Commented Code
/*
  Step 3: Build and render Voronoi cells
  --------------------------------------
  Now that we have a set of random points, we can build a Voronoi diagram.
  - First we compute a Delaunay triangulation (a structure that links the points).
  - From the Delaunay, we derive the Voronoi diagram (the dual graph).
  - Then we draw each Voronoi cell on the canvas.
*/

/*
  Create a Delaunay triangulation from the points.
  - Delaunay.from(points) takes our array of [x, y] coordinates.
  - The Delaunay triangulation ensures that no point lies inside the
    circumcircle of any triangle.
  - This triangulation is the foundation for generating Voronoi cells.
*/
const delaunay = Delaunay.from(points);

/*
  Generate the Voronoi diagram from the Delaunay triangulation.
  - The .voronoi() method converts the triangulation into Voronoi cells.
  - The array [0, 0, width, height] defines the bounding box (the canvas edges).
  - This ensures all Voronoi cells are clipped within the 500×500 canvas.
*/
const voronoi = delaunay.voronoi([0, 0, width, height]);

/*
  Set the stroke style to black for drawing Voronoi cell borders.
  - Every cell is drawn with thin black lines.
*/
ctx.strokeStyle = "black";

/*
  Loop through every site (point) and render its Voronoi cell.
  - voronoi.renderCell(i, ctx) traces the path of the cell for point i.
  - ctx.beginPath() starts a new drawing path.
  - ctx.stroke() actually draws the path (the cell’s outline).
*/
for (let i = 0; i < points.length; i++) {
  ctx.beginPath();
  voronoi.renderCell(i, ctx);
  ctx.stroke();
}

/*
  Next, draw the sites (the original points) themselves.
  - We want to make it clear where the seed points are inside the cells.
*/
ctx.fillStyle = "red"; // Points will be filled in red for visibility.

/*
  For each [x, y] point:
  - Begin a new path with ctx.beginPath().
  - Use ctx.arc() to draw a small circle of radius 3 pixels at (x, y).
  - Use ctx.fill() to fill the circle in red.
*/
for (let [x, y] of points) {
  ctx.beginPath();
  ctx.arc(x, y, 3, 0, 2 * Math.PI); // Full circle (0 to 2π radians).
  ctx.fill();
}

/*
  At this point:
  - The Voronoi cells are drawn in black outlines.
  - The sites (points) are marked as red dots.
  - This gives us a complete Voronoi diagram with visible seed locations.
*/
Uncommented Code
const delaunay = Delaunay.from(points);
const voronoi = delaunay.voronoi([0, 0, width, height]);

ctx.strokeStyle = "black";
for (let i = 0; i < points.length; i++) {
  ctx.beginPath();
  voronoi.renderCell(i, ctx);
  ctx.stroke();
}

ctx.fillStyle = "red";
for (let [x, y] of points) {
  ctx.beginPath();
  ctx.arc(x, y, 3, 0, 2 * Math.PI);
  ctx.fill();
}
// Step 3: Build and render Voronoi cells
// --------------------------------------
// We now use the random points to construct the Voronoi diagram.
// This requires first creating a Delaunay triangulation, then
// converting it into Voronoi cells, and finally rendering them.


// Create a Delaunay triangulation from the points
// - Ensures no point lies inside the circumcircle of any triangle
DECLARE delaunay = Delaunay.FROM(points)

// Generate the Voronoi diagram from the triangulation
// - Clip the diagram to the canvas edges (0, 0, width, height)
DECLARE voronoi = delaunay.VORONOI([0, 0, width, height])

// Set stroke style for cell borders
SET ctx.strokeStyle TO "black"

// Loop through each point and render its Voronoi cell
FOR i FROM 0 TO LENGTH(points) - 1 DO
    ctx.BEGIN_PATH()
    voronoi.RENDER_CELL(i, ctx)   // Trace the cell outline for site i
    ctx.STROKE()                  // Draw the path in black
END FOR


// Draw the original points (sites) in red for visibility
SET ctx.fillStyle TO "red"

// For each point [x, y], draw a small circle at its location
FOR EACH [x, y] IN points DO
    ctx.BEGIN_PATH()
    ctx.ARC(x, y, 3, 0, 2 * PI)   // Draw circle of radius 3 at (x, y)
    ctx.FILL()                    // Fill the circle in red
END FOR


// At this stage:
// - Voronoi cells are outlined in black
// - Seed points are marked as red dots
// - The full Voronoi diagram is complete
👉 Try adding more or fewer points, then refresh — notice how the shapes change.
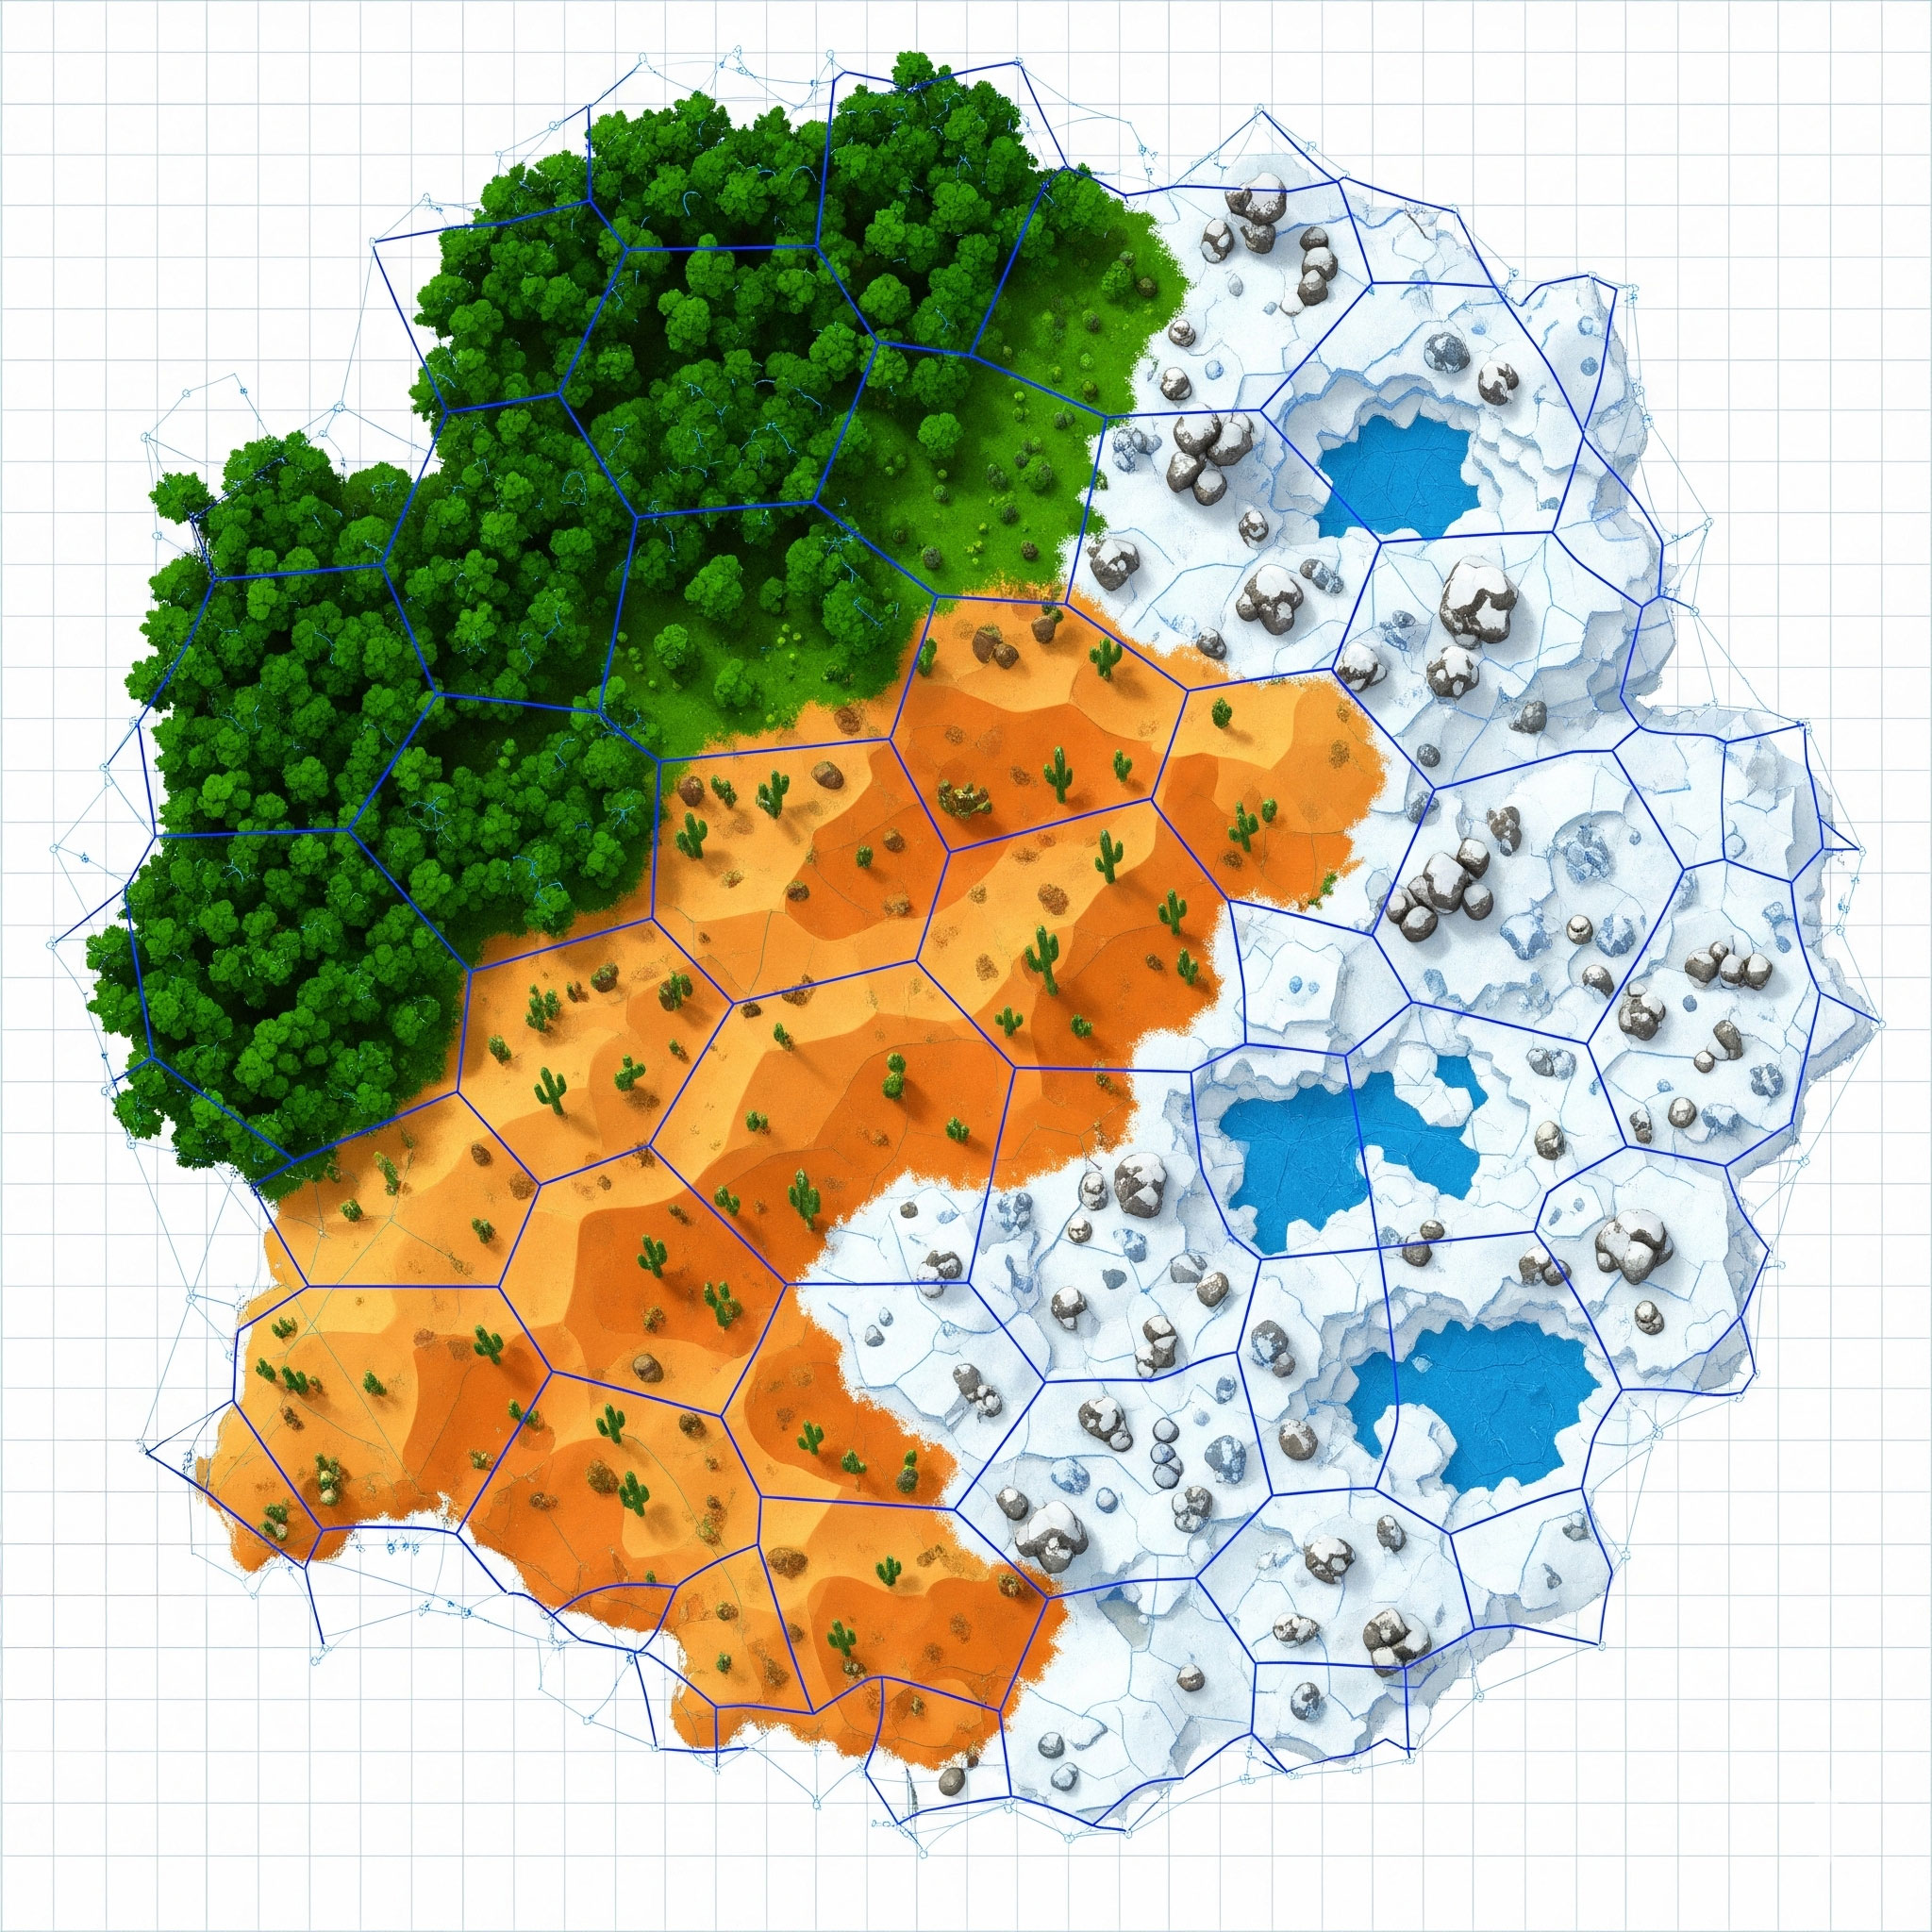
Step-by-Step Lab #2: Voronoi World Map with Biomes
Now let’s turn Voronoi into a procedural world map.
Commented Code
/*
  Step-by-Step Lab #2: Voronoi World Map with Biomes
  --------------------------------------------------
  In this step, we extend our Voronoi diagram by giving each cell a "biome".
  This makes the diagram look like a patchwork map of different terrain types
  (e.g., forest, desert, tundra).

  Concept:
  - Each Voronoi cell represents a region of land.
  - Each region is randomly assigned a biome type.
  - Each biome has a specific color to visually distinguish it on the map.
*/

/*
  Define a list of possible biome types.
  - These are just names for terrain categories.
  - You can expand this list with your own (e.g., "Ocean", "Mountains").
*/
const biomes = ["Forest", "Desert", "Plains", "Swamp", "Tundra"];

/*
  Define a color mapping for each biome type.
  - Keys are biome names.
  - Values are color codes (in HEX format).
  - This lets us quickly look up the correct color for a biome.
*/
const biomeColors = {
  Forest: "#228B22",   // Dark green for forest
  Desert: "#EDC9AF",   // Sandy beige for desert
  Plains: "#98FB98",   // Light green for open grasslands
  Swamp:  "#556B2F",   // Dark olive green for swamp
  Tundra: "#E0FFFF"    // Icy cyan for tundra
};

/*
  Loop over each point/site in the Voronoi diagram.
  - Each point corresponds to a Voronoi cell (region).
  - We will assign a biome to each cell and fill it with that biome’s color.
*/
for (let i = 0; i < points.length; i++) {
  /*
    Pick a random biome from the list.
    - Math.random() * biomes.length gives a random index between 0 and (biomes.length - 1).
    - Math.floor() ensures we round down to a whole number.
  */
  const biome = biomes[Math.floor(Math.random() * biomes.length)];

  /*
    Set the fill color based on the chosen biome.
    - biomeColors[biome] looks up the HEX color for that biome.
  */
  ctx.fillStyle = biomeColors[biome];

  /*
    Draw the Voronoi cell for this site:
    - ctx.beginPath() starts a new drawing path.
    - voronoi.renderCell(i, ctx) creates the shape of the cell.
    - ctx.fill() fills the region with the biome color.
    - ctx.stroke() outlines the cell with the current stroke style (black).
  */
  ctx.beginPath();
  voronoi.renderCell(i, ctx);
  ctx.fill();
  ctx.stroke();
}

/*
  At this point:
  - Each Voronoi cell has been assigned a random biome.
  - The canvas looks like a colorful "world map".
  - This is the foundation for procedural map generation in games.
*/
Uncommented Code
const biomes = ["Forest", "Desert", "Plains", "Swamp", "Tundra"];
const biomeColors = {
  Forest: "#228B22",
  Desert: "#EDC9AF",
  Plains: "#98FB98",
  Swamp: "#556B2F",
  Tundra: "#E0FFFF"
};

for (let i = 0; i < points.length; i++) {
  const biome = biomes[Math.floor(Math.random() * biomes.length)];
  ctx.fillStyle = biomeColors[biome];
  ctx.beginPath();
  voronoi.renderCell(i, ctx);
  ctx.fill();
  ctx.stroke();
}
// Step-by-Step Lab #2: Voronoi World Map with Biomes
// --------------------------------------------------
// Give each Voronoi cell a biome and color it accordingly to create a world-map look.
// Define biome categories (terrain types)
DECLARE biomes = ["Forest", "Desert", "Plains", "Swamp", "Tundra"]
// Define a color lookup table for each biome (HEX colors)
DECLARE biomeColors = DICTIONARY
SET biomeColors["Forest"] = "#228B22" // Dark green
SET biomeColors["Desert"] = "#EDC9AF" // Sandy beige
SET biomeColors["Plains"] = "#98FB98" // Light green
SET biomeColors["Swamp"] = "#556B2F" // Dark olive
SET biomeColors["Tundra"] = "#E0FFFF" // Icy cyan
// For each site (and therefore each Voronoi cell), choose a biome and render the cell
FOR i FROM 0 TO LENGTH(points) - 1 DO
// Pick a random biome index in [0, LENGTH(biomes) - 1]
DECLARE randomIndex = FLOOR(RANDOM() * LENGTH(biomes))
// Select the biome name
DECLARE biome = biomes[randomIndex]
// Set the fill color based on the biome
SET ctx.fillStyle TO biomeColors[biome]
// Trace and fill the Voronoi cell with the biome color, then outline it
ctx.BEGIN_PATH()
voronoi.RENDER_CELL(i, ctx)
ctx.FILL()
ctx.STROKE()
END FOR
// Result:
// - Each Voronoi cell is assigned a biome and colored accordingly
// - The canvas now resembles a colorful procedural world map
Now each cell is a different biome. Add noise-based heightmaps and temperature gradients, and you’ll have the foundations of a full procedural overworld generator.
Step-by-Step Lab #3: Influence Maps for AI
Voronoi diagrams are also great for AI decision-making. Imagine three enemy bases, each wanting to control the nearest territory.
Commented Code
/*
  Step-by-Step Lab #3: Influence Maps for AI
  ------------------------------------------
  Voronoi diagrams are not just for graphics or maps — they are also useful in AI.
  Imagine three enemy bases, each trying to control the territory closest to them.
  - Each base is a "site" in the Voronoi diagram.
  - The diagram divides the map into territories, showing which base controls which region.
  - This technique can be applied in games for AI decision-making, pathfinding, or territory control.
*/

/*
  Define the positions of the enemy bases.
  - Each base is represented as an [x, y] coordinate.
  - Here, we place 3 bases at different locations on the canvas.
*/
const bases = [
  [100, 100],  // Base A in the top-left area
  [400, 120],  // Base B in the top-right area
  [250, 400]   // Base C near the bottom center
];

/*
  Create a Delaunay triangulation from the base positions.
  - From this, we can generate a Voronoi diagram that partitions
    the map into regions of control for each base.
*/
const delaunay = Delaunay.from(bases);

/*
  Generate the Voronoi diagram for the bases.
  - The bounding box [0, 0, width, height] keeps everything inside the canvas.
  - Each Voronoi cell represents the "zone of control" for a base.
*/
const voronoi = delaunay.voronoi([0, 0, width, height]);

/*
  Define a set of colors for the territories.
  - Each base will have its own distinct color to show which area it controls.
  - These are soft pastel-like colors so that the black outlines remain visible.
*/
const colors = ["#ff9999", "#9999ff", "#99ff99"];

/*
  Loop through each base and fill its Voronoi cell with its assigned color.
  - ctx.fillStyle = colors[i] sets the fill color for that base’s territory.
  - voronoi.renderCell(i, ctx) draws the region controlled by base i.
  - ctx.fill() colors in the region.
  - ctx.stroke() draws the border outlines in the current stroke style (default black).
*/
for (let i = 0; i < bases.length; i++) {
  ctx.fillStyle = colors[i];
  ctx.beginPath();
  voronoi.renderCell(i, ctx);
  ctx.fill();
  ctx.stroke();
}

/*
  Finally, draw the bases themselves so they are visible on top of the map.
  - We draw each base as a black circle (radius 5).
  - This makes it easy to see which point each territory belongs to.
*/
ctx.fillStyle = "black";
for (let [x, y] of bases) {
  ctx.beginPath();
  ctx.arc(x, y, 5, 0, 2 * Math.PI); // Circle centered on the base location
  ctx.fill();
}

/*
  At this point:
  - The canvas shows three colored territories (Voronoi cells).
  - Each territory belongs to the closest base.
  - This simulates how AI factions might "claim" parts of a map.

  Game AI Application:
  - Units can decide which base they belong to by checking which cell they are inside.
  - Bases can reinforce or expand their territories visually.
  - Pathfinding can prioritize movement within controlled regions.
*/
Uncommented Code
const bases = [
  [100, 100],
  [400, 120],
  [250, 400]
];

const delaunay = Delaunay.from(bases);
const voronoi = delaunay.voronoi([0, 0, width, height]);

const colors = ["#ff9999", "#9999ff", "#99ff99"];

for (let i = 0; i < bases.length; i++) {
  ctx.fillStyle = colors[i];
  ctx.beginPath();
  voronoi.renderCell(i, ctx);
  ctx.fill();
  ctx.stroke();
}

ctx.fillStyle = "black";
for (let [x, y] of bases) {
  ctx.beginPath();
  ctx.arc(x, y, 5, 0, 2 * Math.PI);
  ctx.fill();
}
// Step 3: Influence Maps for AI
// ------------------------------
// Voronoi diagrams can be used in game AI to divide territory.
// Each base "controls" the region of the map that is closest to it.


// Define positions of enemy bases (sites)
// Each base is represented as [x, y] coordinates
DECLARE bases = [
    [100, 100],   // Base A (top-left)
    [400, 120],   // Base B (top-right)
    [250, 400]    // Base C (bottom-center)
]


// Create a Delaunay triangulation from the base positions
DECLARE delaunay = Delaunay.FROM(bases)


// Generate the Voronoi diagram for the bases
// Bounding box ensures cells are clipped to the canvas
DECLARE voronoi = delaunay.VORONOI([0, 0, width, height])


// Define distinct colors for each territory
DECLARE colors = ["#ff9999", "#9999ff", "#99ff99"]


// Render each base’s Voronoi cell with its assigned color
FOR i FROM 0 TO LENGTH(bases) - 1 DO
    SET ctx.fillStyle TO colors[i]       // Select base’s color
    ctx.BEGIN_PATH()
    voronoi.RENDER_CELL(i, ctx)          // Draw the region for base i
    ctx.FILL()                           // Fill region with color
    ctx.STROKE()                         // Outline with current stroke style
END FOR


// Draw the bases themselves as black circles
SET ctx.fillStyle TO "black"

FOR EACH [x, y] IN bases DO
    ctx.BEGIN_PATH()
    ctx.ARC(x, y, 5, 0, 2 * PI)          // Circle radius 5 at (x, y)
    ctx.FILL()                           // Fill circle black
END FOR


// Result:
// - Three colored territories representing control zones
// - Each base is shown as a black dot at the center of its zone
// - Simulates AI factions dividing a map into territories
Now each cell is a different biome. Add noise-based heightmaps and temperature gradients, and you’ll have the foundations of a full procedural overworld generator.
Now each base controls a territory. You can use these regions to:
- Spawn units in each faction’s zone.
- Guide patrol AI within their own areas.
- Dynamically expand control as the game progresses.
Making It Interactive
Here are some playful ideas to expand your labs:
- Click-to-add sites: Let users click on the canvas to add a new cell.
- Drag bases around: Watch territories update in real time.
- Weighted Voronoi: Use sliders to give some sites more “influence,” making their cells bigger.
- Dynamic Voronoi: Recalculate every frame for moving objects (great for RTS games).
Voronoi: Click to Add Sites
Voronoi Territories: Drag the Bases
Weighted Voronoi
Dynamic Voronoi: Play / Pause
Common Pitfalls
- Unbounded cells: By default, Voronoi regions extend to infinity. Always clip them to your canvas or map bounds.
- Performance: Large numbers of sites can slow rendering. Consider limiting sites, using spatial partitioning, or only updating nearby cells.
- Aliasing: On grid-based Voronoi, jagged edges may appear. Anti-aliasing or polygon clipping helps.
Real Games That Use Voronoi
Voronoi isn’t just theory — it’s used in many successful games:
- Civilization series: Splits the world into cultural and political territories.
- Minecraft: Biomes are distributed with Voronoi-like techniques.
- RTS games: Use Voronoi for AI influence maps and territorial control.
- Indie dungeon generators: Partition space into rooms and zones.
Extensions and Variations
- Lloyd Relaxation: Iteratively move sites to the centroid of their cells. This smooths jagged cells into more natural shapes.
- Weighted Voronoi (Power diagrams): Give some points more strength to create larger territories — perfect for powerful factions or boss lairs.
- 3D Voronoi: Extend into 3D for caves, asteroids, or space maps.
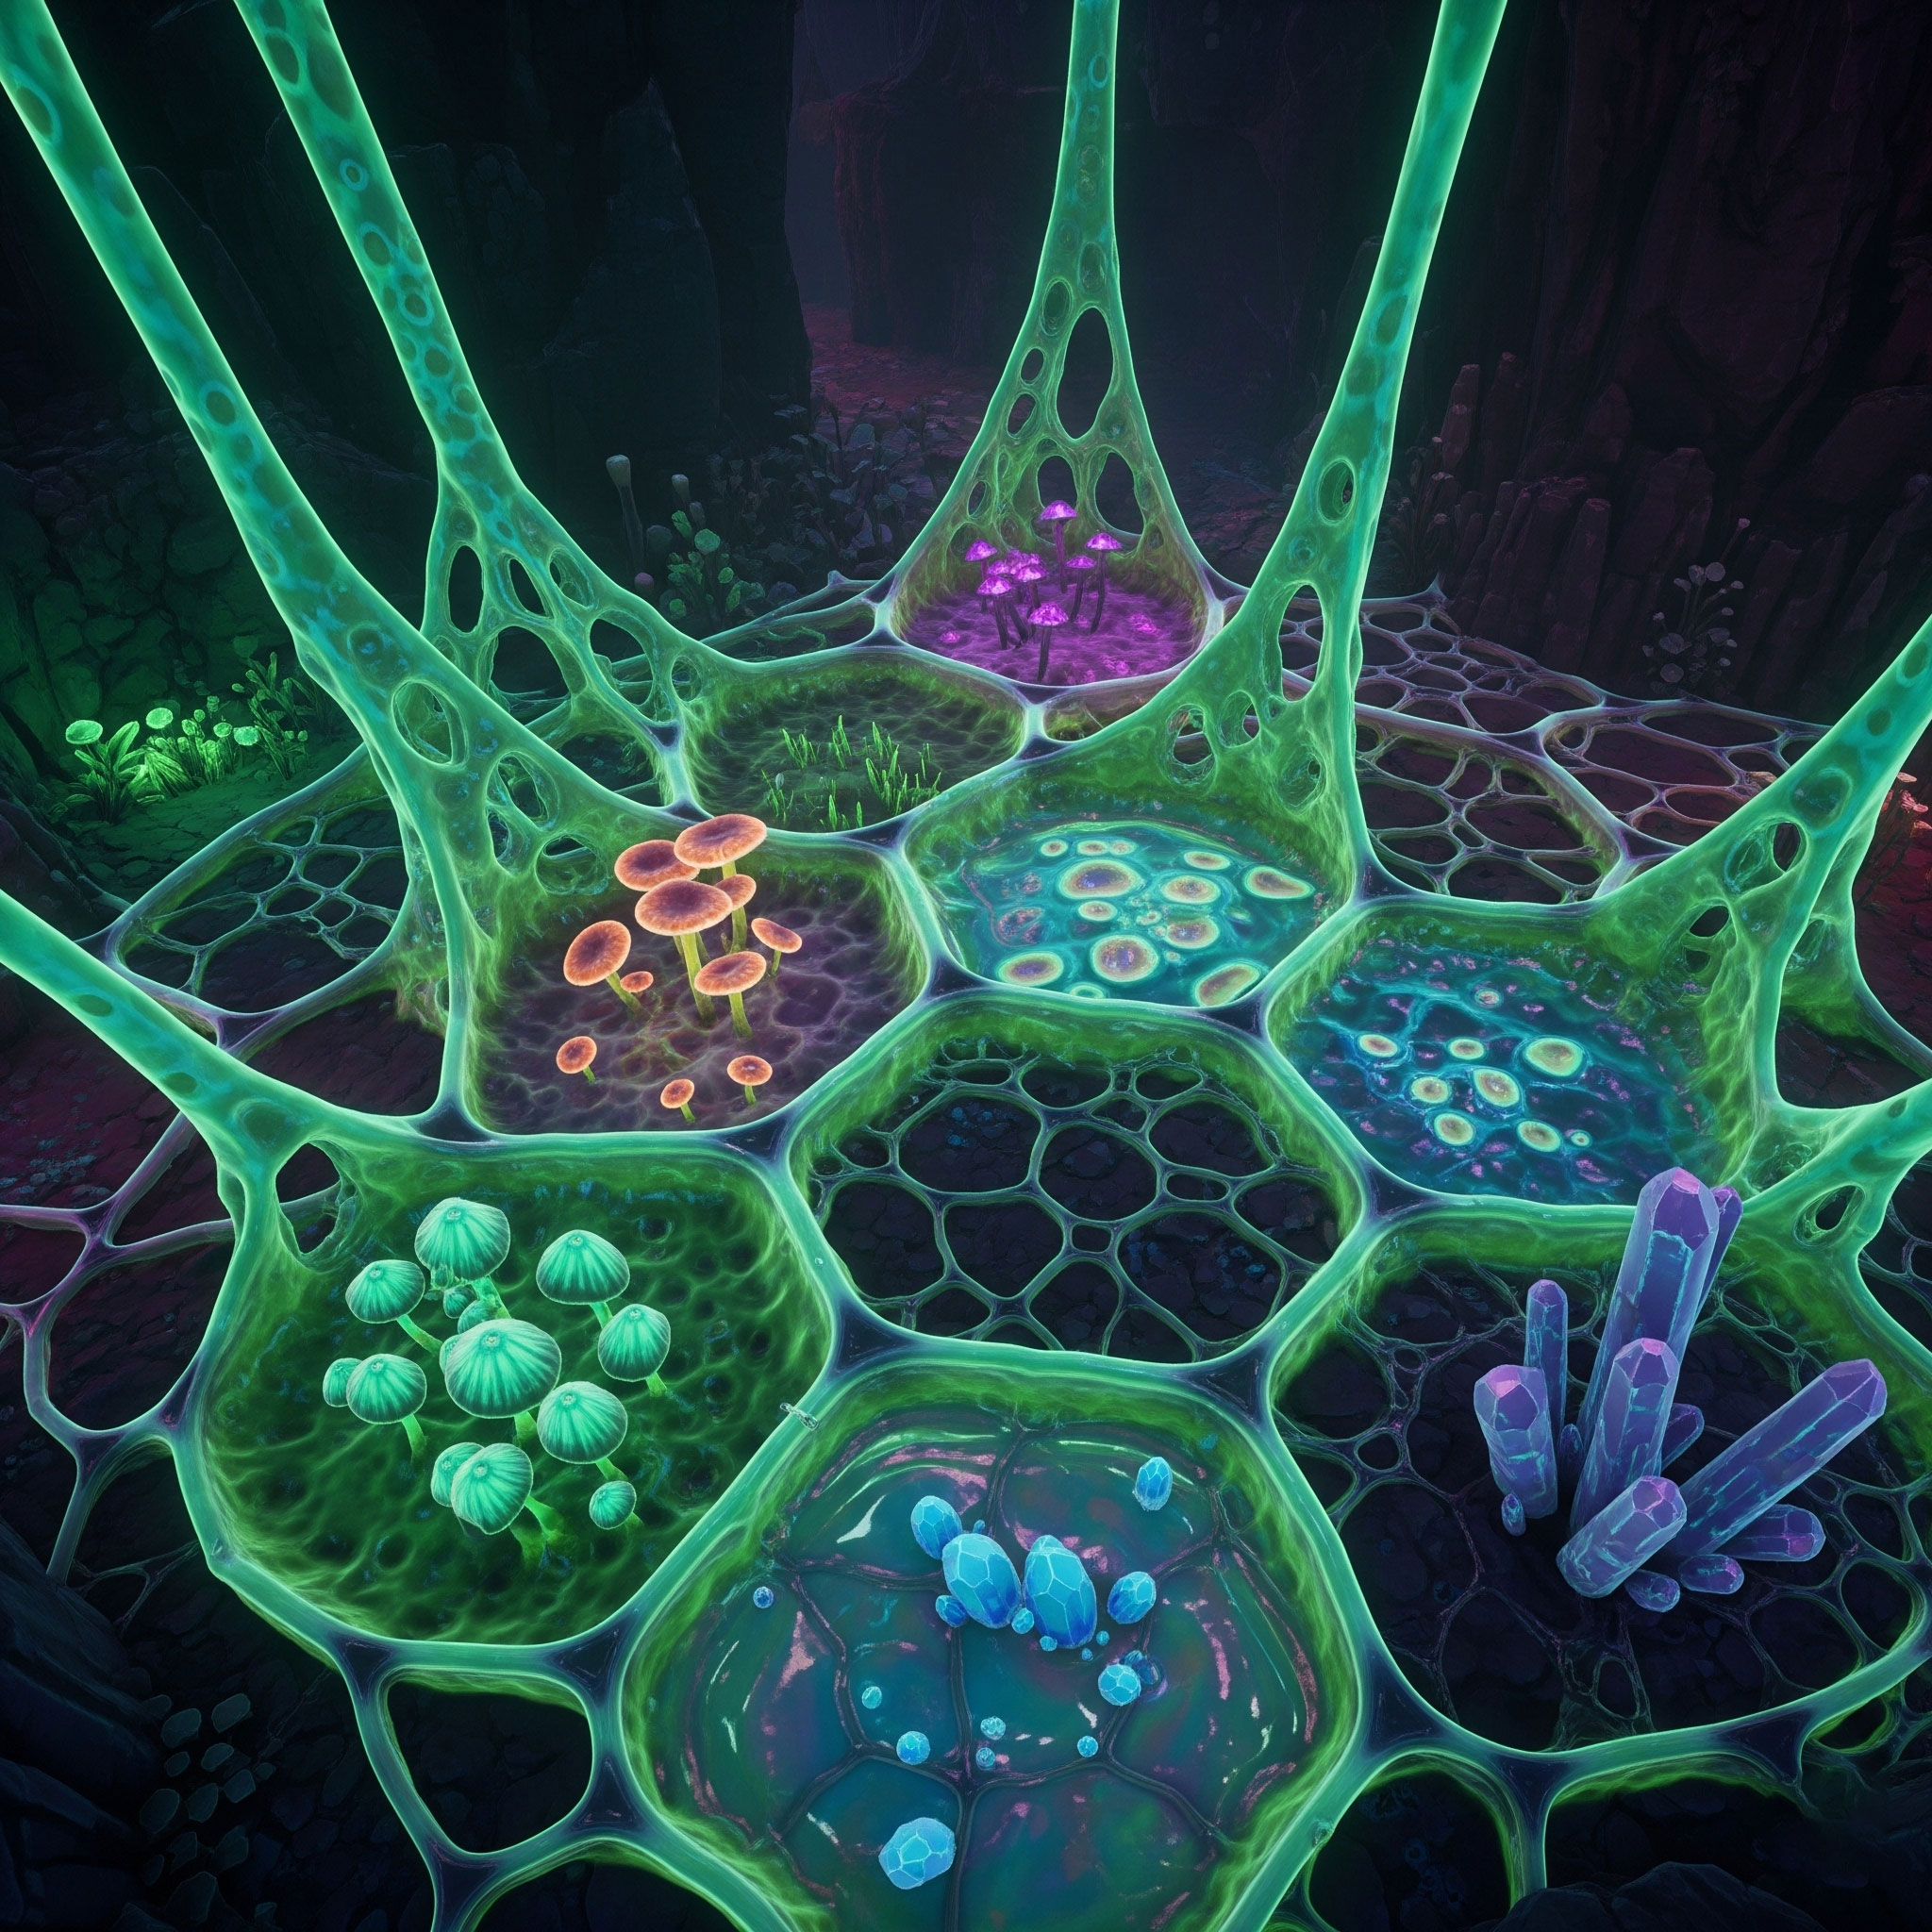
- Voronoi Textures: Use Voronoi noise in shaders for crackling stone, alien skin, or magical energy effects.
Final Thoughts
Voronoi diagrams bridge math and creativity. They allow you to carve out space in organic, surprising ways — whether you’re designing procedural worlds, simulating AI factions, or just experimenting with generative art.
Start simple, layer in interactivity, and soon you’ll see just how versatile this technique can be.
Next steps: Try combining Voronoi with Perlin noise or cellular automata (we’ll cover in future tutorials on Game Genius Lab).
This Post Has 0 Comments